


- Il sistema di monitoraggio salariale della BCE è stato aggiornato con gli accordi salariali firmati fino alla prima settimana di luglio 2026; l’orizzonte temporale di previsione è stato esteso fino alla fine di marzo 2027.
- Le informazioni prospettiche continuano a indicare una pressione salariale negoziata stabile nel 2026 e nel primo trimestre del 2027.
 (AGENPARL) - Roma, 30 Luglio 2026 - L’indicatore salariale della Banca Centrale Europea (BCE), che copre i contratti collettivi di lavoro in vigore, segnala pressioni salariali negoziate, con pagamenti una tantum ponderati, pari al 2,3% nel 2026 (sulla base di una copertura del 44,3% dei dipendenti nei paesi partecipanti) e al 2,7% nel primo trimestre del 2027 (sulla base di una copertura del 28,4%).
L’orizzonte temporale del sistema di monitoraggio salariale è stato esteso fino a marzo 2027. Con la firma di nuovi accordi e il progressivo aumento della copertura dei contratti in scadenza nel 2027, l’orizzonte temporale del sistema di monitoraggio salariale verrà ulteriormente esteso al secondo trimestre del 2027 nella pubblicazione dei dati di settembre 2026.
Rispetto ai dati pubblicati a giugno 2026 , l’indicatore salariale della BCE, che include i pagamenti una tantum ponderati, rimane sostanzialmente invariato per il 2026, e i nuovi accordi non hanno comportato modifiche sostanziali nella valutazione delle pressioni salariali negoziate per quest’anno.
L’indicatore salariale della BCE, nella sua versione principale, è più adatto a descrivere le dinamiche trimestrali o mensili dei salari negoziati, in quanto uniforma i pagamenti una tantum nel tempo. Al contrario, l’indicatore salariale della BCE con pagamenti una tantum non uniformi è più adatto a descrivere le dinamiche annuali dei salari negoziati.
L’indicatore salariale della BCE, che include i pagamenti una tantum non ponderati, indica una crescita stabile dei salari negoziati pari al 2,6% nel 2026 e al 2,7% nel primo trimestre del 2027. Anche l’indicatore salariale che esclude i pagamenti una tantum si attesta al 2,6% nel 2026 e al 2,7% nel primo trimestre del 2027.
Per il 2026, l’ indicatore principale della BCE relativo agli aumenti salariali si attesta in media all’1,8% nel primo trimestre, al 2,1% nel secondo trimestre e al 2,6% nel terzo e quarto trimestre. Questo aumento nel corso dell’anno riflette l’attenuarsi dell’effetto meccanico al ribasso dei grandi pagamenti una tantum effettuati nel 2024 ma non nel 2025. Tale effetto meccanico scompare praticamente nella seconda metà del 2026 nell’indicatore principale. L’indicatore principale relativo agli aumenti salariali si attesta al 2,7% nel primo trimestre del 2027, indicando pressioni salariali negoziate sostanzialmente stabili all’inizio dell’anno e un ruolo attualmente limitato per i pagamenti una tantum.
L’ indice salariale della BCE, comprensivo di pagamenti una tantum non ammortizzati, si attesta in media al 2,9% nel primo trimestre, al 2,6% nel secondo trimestre e al 2,5% nel terzo e quarto trimestre. L’ indice salariale, escludendo i pagamenti una tantum, rimane stabile intorno al 2,6% per tutto il 2026. Per il primo trimestre del 2027, l’indice salariale, sia con che senza pagamenti una tantum non ammortizzati, raggiunge il 2,7%.
La copertura assicurativa dei dipendenti per il 2026 si attesta al 47,0% nel primo trimestre dell’anno, al 45,7% nel secondo trimestre, al 42,5% nel terzo trimestre e al 42,0% nel quarto trimestre. La copertura assicurativa dei dipendenti scende al 28,4% nel primo trimestre del 2027. Si vedano il Grafico 1 e la Tabella 1 per ulteriori dettagli.
Nel complesso, l’indicatore salariale della BCE potrebbe essere soggetto a revisioni e la componente prospettica non deve essere interpretata come una previsione, in quanto include solo le informazioni attualmente disponibili per i contratti collettivi in essere. Inoltre, l’indicatore salariale della BCE non traccia con precisione l’indicatore della crescita dei salari negoziati e sono da prevedere delle deviazioni nel tempo. Per una valutazione più completa dell’andamento salariale nell’area dell’euro, si rimanda alle proiezioni macroeconomiche del personale dell’Eurosistema per l’area dell’euro di giugno 2026 , che indicano un tasso di crescita annuo della remunerazione per dipendente nell’area dell’euro del 3,2% nel 2026.
La BCE pubblica sul Portale dati della BCE quattro indicatori di monitoraggio salariale per l’insieme dei nove paesi partecipanti all’area dell’euro .
Grafico 1
Monitoraggio salariale della BCE: segnali previsionali per i salari negoziati e revisioni ai dati precedenti.
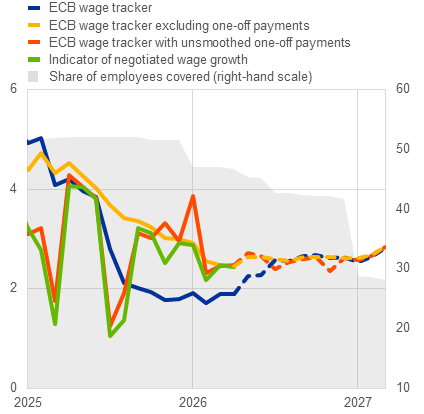
Cosa indicano i quattro diversi indicatori?
- L’indicatore salariale principale della BCE è un indicatore della crescita salariale negoziata che include pagamenti una tantum concordati collettivamente, come quelli relativi all’adeguamento all’inflazione, ai bonus o agli arretrati, che vengono livellati su 12 mesi.
- Il tracker salariale della BCE, escludendo i pagamenti una tantum, riflette l’entità degli aumenti salariali strutturali (o permanenti) negoziati.
- L’indicatore salariale della BCE con pagamenti una tantum non livellati è costruito utilizzando una metodologia che, sia in termini di fonti di dati che di metodologia statistica, è concettualmente simile, ma non necessariamente identica, a quella utilizzata per l’indicatore BCE della crescita dei salari negoziati.
- La quota di dipendenti coperti rappresenta la percentuale di dipendenti nei paesi partecipanti che sono direttamente coperti dai dati del sistema di monitoraggio salariale della BCE. Questo indicatore fornisce informazioni sulla rappresentatività dei segnali di crescita salariale (negoziati) sottostanti, ottenuti dall’insieme degli indicatori del sistema di monitoraggio salariale per l’aggregato dei paesi partecipanti. La copertura dei dipendenti varia da paese a paese e all’interno di ciascun paese nel corso del tempo (maggiori dettagli sono disponibili nella Tabella 2).
Tabella 1
Riepilogo del monitoraggio salariale della BCE
(percentuali)
| Strumento di monitoraggio salariale della BCE | Copertura | |||
|---|---|---|---|---|
| Indicatore principale | Con pagamenti una tantum non uniformi | Esclusi i pagamenti una tantum | Percentuale di dipendenti (%) | |
| 2013-24 | 2.2 | 2.3 | 2.1 | 50,9 |
| 2025 | 3.2 | 3.0 | 3.8 | 51.8 |
| 2026 | 2.3 | 2.6 | 2.6 | 44.3 |
| Primo trimestre 2026 | 1.8 | 2.9 | 2.6 | 47.0 |
| Aprile 2026 | 1.9 | 2.5 | 2.5 | 46,7 |
| Maggio 2026 | 2.3 | 2.7 | 2.6 | 45.3 |
| Giugno 2026 | 2.3 | 2.7 | 2.6 | 45.2 |
| Luglio 2026 | 2.6 | 2.4 | 2.6 | 42,7 |
| Agosto 2026 | 2.6 | 2.5 | 2.6 | 42,6 |
| Settembre 2026 | 2.7 | 2.6 | 2.6 | 42.4 |
| quarto trimestre 2026 | 2.6 | 2.5 | 2.6 | 42.0 |
| Primo trimestre 2027 | 2.7 | 2.7 | 2.7 | 28.4 |
Fonti: calcoli della BCE basati su dati forniti da Nationale Bank van België/Banque nationale de Belgique, Servizio pubblico federale belga per l’occupazione, il lavoro e il dialogo sociale, Ufficio nazionale belga per la sicurezza sociale, Deutsche Bundesbank, Banca di Grecia, Banco de España, Banque de France, Banca d’Italia, l’associazione olandese dei datori di lavoro AWVN, Oesterreichische Nationalbank, Suomen Pankki – Banca di Finlandia, Confederazione delle industrie finlandesi, Statistics Finland ed Eurostat.
Note: gli indicatori del tracker salariale della BCE riflettono la crescita annua dei salari negoziati in percentuale. La copertura è definita come la quota di dipendenti nei paesi partecipanti in percentuale. Le righe con valori in corsivo e in grassetto si riferiscono all’aspetto prospettico dei rispettivi indicatori. I dati sono soggetti a revisione.
Tabella 2
Copertura assicurativa dei dipendenti per paese
(quota di dipendenti in ciascun paese, in percentuale)
| Belgio | Germania | Grecia | Spagna | Francia | Italia | Paesi Bassi | Austria | Finlandia | Area Euro | |
|---|---|---|---|---|---|---|---|---|---|---|
| 2013-25 | 38.7 | 42,7 | 18.5 | 62,7 | 52,5 | 51,5 | 63,9 | 75,5 | 65,9 | 51.0 |
| 2026 | 44,9 | 40.3 | 22,5 | 39.0 | 44.2 | 48.3 | 59.3 | 69,8 | 61.7 | 44.3 |
| Primo trimestre 2026 | 44,8 | 45,7 | 22.9 | 41.0 | 46.2 | 48.4 | 60.2 | 75,5 | 62,6 | 47.0 |
| Secondo trimestre 2026 | 44,9 | 43.4 | 22,5 | 40.2 | 45.0 | 48,5 | 59,9 | 70.2 | 62.3 | 45,7 |
| terzo trimestre 2026 | 44,9 | 36.3 | 22.3 | 37,5 | 43.1 | 48,5 | 58,8 | 67,7 | 61.7 | 42,5 |
| quarto trimestre 2026 | 44,9 | 35.9 | 22.3 | 37.3 | 42,6 | 47,6 | 58.4 | 65,8 | 60,5 | 42.0 |
| Primo trimestre 2027 | 44,8 | 32.4 | 14.4 | 9.3 | 18.5 | 38.7 | 44,5 | 37.9 | 59,9 | 28.4 |
Fonti: Calcoli della BCE basati su dati forniti da Nationale Bank van België/Banque nationale de Belgique, Servizio pubblico federale belga per l’occupazione, il lavoro e il dialogo sociale, Ufficio nazionale belga per la sicurezza sociale, Deutsche Bundesbank, Banca di Grecia, Banco de España, Banque de France, Banca d’Italia, l’associazione olandese dei datori di lavoro AWVN, Oesterreichische Nationalbank, Suomen Pankki – Banca di Finlandia, Confederazione delle industrie finlandesi, Statistics Finland ed Eurostat.
Note: L’aggregato dell’area euro comprende i nove paesi partecipanti al monitoraggio salariale. La copertura mostra la forza relativa dei segnali salariali per ciascun paese e per l’area euro. La media storica è calcolata da gennaio 2015 per la Finlandia e da gennaio 2016 per la Grecia. Per gli altri paesi, è calcolata da gennaio 2013 a dicembre 2025. Le righe con valori in corsivo e in grassetto si riferiscono all’aspetto prospettico dell’indicatore. I dati sono soggetti a revisione.
Per richieste da parte dei media, si prega di contattare Benoit Deeg , tel.: +491721683704
Note:
- Il sistema di monitoraggio salariale della BCE è il risultato di una partnership dell’Eurosistema che attualmente comprende la BCE e nove banche centrali nazionali dell’area euro: la Nationale Bank van België/Banque nationale de Belgique, la Deutsche Bundesbank, la Bank of Greece, la Banco de España, la Banque de France, la Banca d’Italia, la De Nederlandsche Bank, la Oesterreichische Nationalbank e la Suomen Pankki – Finlands Bank. Si basa su un database estremamente dettagliato di contratti collettivi di lavoro attivi per Belgio, Germania, Grecia, Spagna, Francia, Italia, Paesi Bassi, Austria e Finlandia. Il sistema di monitoraggio salariale può essere utilizzato per valutare le pressioni salariali nell’area euro.
- La metodologia di monitoraggio salariale utilizza un approccio di doppia aggregazione. In primo luogo, aggrega le informazioni altamente dettagliate sui contratti collettivi di lavoro e costruisce gli indicatori di monitoraggio salariale a livello nazionale utilizzando le informazioni sulla copertura occupazionale in ciascun paese. In secondo luogo, utilizza queste informazioni per costruire l’aggregato per l’area dell’euro utilizzando pesi variabili nel tempo basati sulla retribuzione totale dei dipendenti nei paesi partecipanti.
- Dato che la natura previsionale del tracker dipende dal database sottostante dei contratti collettivi di lavoro, i segnali salariali devono sempre essere considerati condizionati dalle informazioni disponibili in un dato momento e quindi soggetti a revisione. Ciò è particolarmente rilevante a cavallo tra i due anni, poiché in alcuni paesi molti accordi vengono firmati o rinnovati nel primo trimestre.
*********
ECB wage tracker at 2.7% in Q1 2027, indicating stable negotiated wage pressures
29 July 2026
- ECB wage tracker updated with wage agreements signed up to first week of July 2026; forward-looking horizon extended to end of March 2027
- Forward-looking information continues to indicate stable negotiated wage pressures in 2026 and first quarter of 2027
The European Central Bank (ECB) wage tracker, which covers active collective bargaining agreements, indicates negotiated wage pressures with smoothed one-off payments of 2.3% in 2026 (based on a coverage of 44.3% of employees in participating countries) and of 2.7% in the first quarter of 2027 (based on a coverage of 28.4%).
The forward-looking horizon of the wage tracker has been extended up to March 2027. As new agreements are being signed and coverage of contracts reaching 2027 is gradually increasing, the forward-looking horizon of the wage tracker will be further extended to the second quarter of 2027 in the September 2026 data release.
Compared with the June 2026 data release, the ECB wage tracker with smoothed one-off payments remains broadly unchanged for 2026, with new agreements not leading to a material change in the assessment of negotiated wage pressures for this year.
The headline ECB wage tracker is better suited to describe quarterly or monthly dynamics in negotiated wages as it smooths one-off payments over time. By contrast, the ECB wage tracker with unsmoothed one-off payments is better suited to describing yearly dynamics in negotiated wages.
The ECB wage tracker with unsmoothed one-off payments indicates stable negotiated wage growth of 2.6% in 2026 and 2.7% in the first quarter of 2027. The wage tracker excluding one-off payments also stands at 2.6% in 2026 and 2.7% in the first quarter of 2027.
For 2026, the headline ECB wage tracker averages 1.8% in the first quarter, 2.1% in the second quarter and 2.6% in the third and fourth quarters. This increase over the course of the year reflects the fading mechanical downward effect of large one-off payments that were made in 2024 but not in 2025. This mechanical effect virtually disappears in the second half of 2026 in the headline indicator. The headline wage tracker stands at 2.7% in the first quarter of 2027, indicating broadly stable negotiated wage pressures at the turn of the year and a currently limited role for one-off payments.
The ECB wage tracker with unsmoothed one-off payments averages 2.9% in the first quarter, 2.6% in the second quarter and 2.5% in the third and fourth quarters. The wage tracker excluding one-off payments remains stable at around 2.6% throughout 2026. For the first quarter of 2027, the wage tracker both with unsmoothed one-off payments and excluding one-off payments reaches 2.7%.
Employee coverage for 2026 stands at 47.0% in the first quarter of the year, 45.7% in the second quarter, 42.5% in the third quarter and 42.0% in the fourth quarter. The employee coverage decreases to 28.4% in the first quarter of 2027. See Chart 1 and Table 1 for further details.
Overall, the ECB wage tracker may be subject to revision, and the forward-looking component should not be interpreted as a forecast, as it only captures information that is currently available for active collective bargaining agreements. Moreover, the ECB wage tracker does not track the indicator of negotiated wage growth precisely, and deviations are to be expected over time. For a more comprehensive assessment of wage developments in the euro area, please refer to the June 2026 Eurosystem staff macroeconomic projections for the euro area, which indicate a yearly growth rate of compensation per employee in the euro area of 3.2% in 2026.
The ECB publishes four wage tracker indicators for the aggregate of the nine participating euro area countries on the ECB Data Portal.
Chart 1
ECB wage tracker: forward-looking signals for negotiated wages and revisions to the previous data release
What do the four different indicators show?
- The headline ECB wage tracker is a tracker of negotiated wage growth that includes collectively agreed one-off payments, such as those related to inflation compensation, bonuses or back-dated pay, which are smoothed over 12 months.
- The ECB wage tracker excluding one-off payments reflects the extent of structural (or permanent) negotiated wage increases.
- The ECB wage tracker with unsmoothed one-off payments is constructed using a methodology that, in terms of both data sources and statistical methodology, is conceptually similar to, but not necessarily the same as, that used for the ECB indicator of negotiated wage growth.
- The share of employees covered is the percentage of employees across the participating countries that are directly covered by ECB wage tracker data. This indicator provides information on the representativeness of the underlying (negotiated) wage growth signals obtained from the set of wage tracker indicators for the aggregate of the participating countries. Employee coverage differs across countries and within each country over time (more details can be found in Table 2).
Table 1
ECB wage tracker summary
(percentages)
| ECB wage tracker | Coverage | |||
|---|---|---|---|---|
| Headline indicator | With unsmoothed one-off payments | Excluding one-off payments | Share of employees (%) | |
| 2013-24 | 2.2 | 2.3 | 2.1 | 50.9 |
| 2025 | 3.2 | 3.0 | 3.8 | 51.8 |
| 2026 | 2.3 | 2.6 | 2.6 | 44.3 |
| Q1 2026 | 1.8 | 2.9 | 2.6 | 47.0 |
| April 2026 | 1.9 | 2.5 | 2.5 | 46.7 |
| May 2026 | 2.3 | 2.7 | 2.6 | 45.3 |
| June 2026 | 2.3 | 2.7 | 2.6 | 45.2 |
| July 2026 | 2.6 | 2.4 | 2.6 | 42.7 |
| August 2026 | 2.6 | 2.5 | 2.6 | 42.6 |
| September 2026 | 2.7 | 2.6 | 2.6 | 42.4 |
| Q4 2026 | 2.6 | 2.5 | 2.6 | 42.0 |
| Q1 2027 | 2.7 | 2.7 | 2.7 | 28.4 |
Sources: ECB calculations based on data provided by the Nationale Bank van België/Banque nationale de Belgique, the Belgian Federal Public Service Employment, Labour and Social Dialogue, the Belgian National Social Security Office, the Deutsche Bundesbank, the Bank of Greece, the Banco de España, the Banque de France, the Banca d’Italia, the Dutch employers’ association AWVN, the Oesterreichische Nationalbank, Suomen Pankki – Finlands Bank, the Confederation of Finnish Industries, Statistics Finland and Eurostat.
Notes: ECB wage tracker indicators reflect yearly growth in negotiated wages as a percentage. Coverage is defined as the share of employees in participating countries as a percentage. Rows with values in italics and bold refer to the forward-looking aspect of the respective indicators. Data are subject to revision.
Table 2
Employee coverage by country
(share of employees in each country, percentages)
| Belgium | Germany | Greece | Spain | France | Italy | Netherlands | Austria | Finland | Euro area | |
|---|---|---|---|---|---|---|---|---|---|---|
| 2013-25 | 38.7 | 42.7 | 18.5 | 62.7 | 52.5 | 51.5 | 63.9 | 75.5 | 65.9 | 51.0 |
| 2026 | 44.9 | 40.3 | 22.5 | 39.0 | 44.2 | 48.3 | 59.3 | 69.8 | 61.7 | 44.3 |
| Q1 2026 | 44.8 | 45.7 | 22.9 | 41.0 | 46.2 | 48.4 | 60.2 | 75.5 | 62.6 | 47.0 |
| Q2 2026 | 44.9 | 43.4 | 22.5 | 40.2 | 45.0 | 48.5 | 59.9 | 70.2 | 62.3 | 45.7 |
| Q3 2026 | 44.9 | 36.3 | 22.3 | 37.5 | 43.1 | 48.5 | 58.8 | 67.7 | 61.7 | 42.5 |
| Q4 2026 | 44.9 | 35.9 | 22.3 | 37.3 | 42.6 | 47.6 | 58.4 | 65.8 | 60.5 | 42.0 |
| Q1 2027 | 44.8 | 32.4 | 14.4 | 9.3 | 18.5 | 38.7 | 44.5 | 37.9 | 59.9 | 28.4 |
Sources: ECB calculations based on data provided by the Nationale Bank van België/Banque nationale de Belgique, the Belgian Federal Public Service Employment, Labour and Social Dialogue, the Belgian National Social Security Office, the Deutsche Bundesbank, the Bank of Greece, the Banco de España, the Banque de France, the Banca d’Italia, the Dutch employers’ association AWVN, the Oesterreichische Nationalbank, Suomen Pankki – Finlands Bank, the Confederation of Finnish Industries, Statistics Finland and Eurostat.
Notes: The euro area aggregate comprises the nine participating wage tracker countries. The coverage shows the relative strength of wage signals for each country and the euro area. The historical average is calculated from January 2015 for Finland and January 2016 for Greece. For the other countries, it is calculated from January 2013 to December 2025. Rows with values in italics and bold refer to the forward-looking aspect of the indicator. Data are subject to revision.
For media queries, please contact Benoit Deeg, tel.: +491721683704
Notes:
- The ECB wage tracker is the result of a Eurosystem partnership currently comprising the ECB and nine euro area national central banks: the Nationale Bank van België/Banque nationale de Belgique, the Deutsche Bundesbank, the Bank of Greece, the Banco de España, the Banque de France, the Banca d’Italia, De Nederlandsche Bank, the Oesterreichische Nationalbank and Suomen Pankki – Finlands Bank. It is based on a highly granular database of active collective bargaining agreements for Belgium, Germany, Greece, Spain, France, Italy, the Netherlands, Austria and Finland. The wage tracker can be used to help assess wage pressures in the euro area.
- The wage tracker methodology uses a double aggregation approach. First, it aggregates the highly granular information on collective bargaining agreements and constructs the wage tracker indicators at the country level using information on the employee coverage within each country. Second, it uses this information to construct the aggregate for the euro area using time-varying weights based on the total compensation of employees among the participating countries.
- Given that the forward-looking nature of the tracker is dependent on the underlying collective bargaining agreements database, the wage signals should always be considered conditional on the information available at any given point in time and thus subject to revision. This is particularly relevant at the turn of the year, as many agreements are signed or renewed in the first quarter in some countries.
